Summary #
In some cases the Web Service Connector tool in TaskCentre runs into problems due to the operation schema not matching the real data structure. To fix the mismatching schemas they need to be manually altered in the web service tool’s global configuration.
In this article we will describe an overview of diagnosing schema problems by using a web proxy to analyse web traffic.
What is Web Proxy? #
A web proxy can be used as a Web Debugging Proxy which logs all HTTP(S) traffic between your computer and the Internet. A web proxy such as Fiddler allows you to inspect traffic, set breakpoints, and “fiddle” with incoming or outgoing data. It includes a powerful event-based scripting subsystem, and can be extended using any .NET language.
Fiddler is freeware and can debug traffic from virtually any application that supports a proxy, including Internet Explorer, Google Chrome, Apple Safari, Mozilla Firefox, Opera, and thousands more. You can also debug traffic from popular devices like Windows Phone, iPod/iPad, and others.
Before you begin #
The reader of this article is expected to be familiar with the following:
- Usage of TaskCentre
- Creating Web Service global configurations in TaskCentre
- XML schemas
System Requirements #
- TaskCentre has to be installed
- The Web Service Connector tool has to be installed
- The host system has to meet TaskCentre system prerequisites
Instructions #
The procedure outlined below uses the web proxy Fiddler as an example.
- Download and install Fiddler from here: http://www.telerik.com/download/fiddler
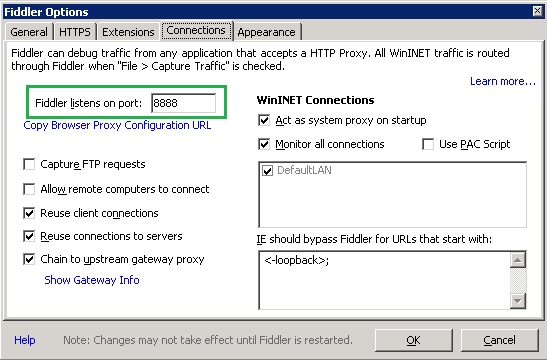
- Verify your machines IP and check which port Fiddler is listening to. Go to the menu: Tools \ Fiddler Options

- Modify the TaskCentre task runner configuration file to set up fiddler as a proxy for the runtime task execution. Please see instructions in the following KB article:
Configuring the Web Service Connector Tool to work with a proxy server
Using Fiddler #
Let’s assume we have a task where the web service connector step has failed to produce the result we expected, the TaskCentre log file has given us some feedback but we would like more information to help with the analysis.
- Start Fiddler and then queue the task in question. When the web connector step starts producing http traffic you will notice entries appear in Fiddler.
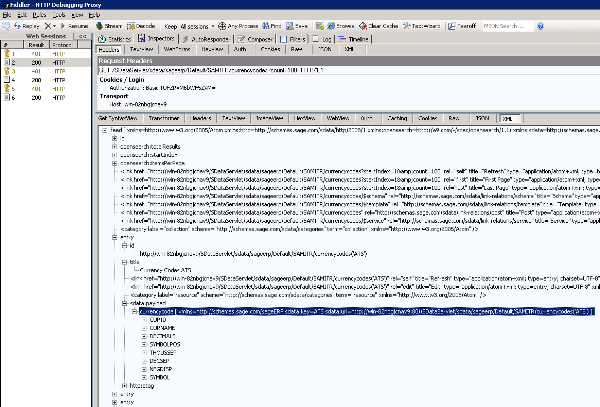
- Select the entry in the left hand pane to see more detailed information in the right hand pane.
- Select the XML tabs for the header and detail. You may be prompted by Fiddler to decode the message, select yes to this option.
You will then see the detailed traffic which can then be analysed and validated against schema settings at global configuration.
The screenshot below shows a sample of what to expect from Fiddler:

This completes setting up a web proxy to analyse web traffic.
